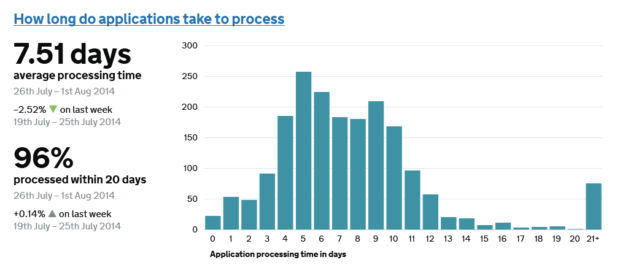
I'm working on the performance platform. We're showing data about how government services are doing, to help people who work on government services to improve them.
I've been working on a new module to show how long you might have to wait for a department to get back to you.

In this example, a typical application takes just over a week to process, and almost all applications are processed within about 12 days.
Right now, this is just a sketch, drawn in InDesign. But we're working with the Legal Aid Agency to start publishing this and other information on dashboards for the civil servants working on these transactions.
In the future, we'll be embedding this data on service start pages, so you can immediately see the average waiting time for the service.

2 comments
Comment by john posted on
Is there any practical way for the user not to have to do the maths? Im thinking of their being given a date when they can expect their issue to be addressed rather than the average wait figure. Fior example: you type in date you applied and are given a response date (some aggregation of average wait + average time for their request to have been received by governement).
Comment by Henry Hadlow posted on
Hi John, thanks for the comment. Right now we're at the early stage of putting this data on the dashboards we're creating for civil servants (for example, https://www.gov.uk/performance/carers-allowance).
But we'd like to make this more user friendly – we'll be making this data available through an API, so the teams building transactions can display an expected date to end users. There's a fair bit of technical work to do before we can do this!